Creating Report with Chart for Dashboard
Purpose: To explain the process of creating a report for the dashboard. Check out the new
video pertaining to this topic!
Prerequisites: Novo initial software settings, Module configuration, Data within the area of Novo for which you are running a report. The ability to edit or run reports is based on the permissions for your respective role.
Steps:
- Click Admin->Reports. The Report Writer Manage Reports page is now visible.
- Click Add New link next to the type of report you want to create. The Choose Report Type page is now visible.
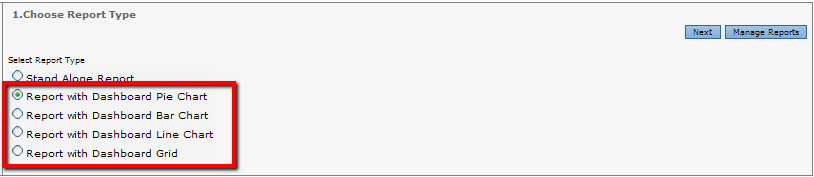
- Choose the Report Type with the appropriate chart then click Next.
- Select the columns you want on the report by clicking on a column name i.e. Ticket: #. Press and hold Control (Ctrl) keyboard key while selecting column names to select multiple columns.
- Click Add >>> to add the column to the selected columns box.
- Click Next to go to the Column Properties page.
- Setup Column Properties for the desired report output.
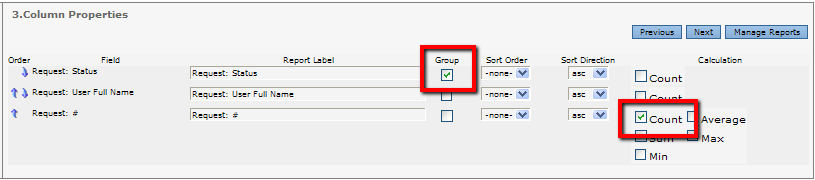
Note: The Group option must be set for a column when creating a dashboard chart. For the bar chart, the group option will be the vertical axis; for the pie chart, the group option will be the characteristic used for the slices; for the line chart, the group option will be the horizontal axis.
Note: The Count option must be set for a column when creating a dashboard chart. For the bar chart, the count option will be the horizontal axis; for the pie chart, the count option will be the size of the slice; for the line chart, the count option will be the vertical axis.
- Click Next to go to the Select Report Filters page. Filtering the data is not mandatory for every report. It is up to the user whether data on the report is filtered.
- To bypass the select report filters step, click the next button.
- If the selection of the report filters step was bypassed, then the defining of the filters must be skipped as well. Press the next button.
- The Email Scheduler page is next. For more information, check out this video!
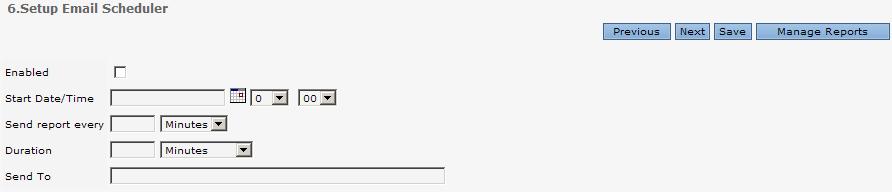
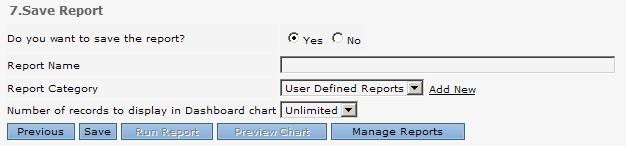
- Click Next to go to the Save Report page.
- Click Yes.
- Enter a report title.
- Enter a Report Category
- Enter the Number of Records to Display
- Click Save then Preview Chart to view the chart.
Sub Articles
 Best Practices for Creating a Report with a Chart